
Every guide to posting times gives you the same answer: a heat map, borrowed from a social media agency's blog, telling you Tuesday at 11am. None of them ran the test on your account.
I run three AI-generated vertical clips a day on a fixed schedule, on the same channel, for the same store. The slots never move. That accidentally makes a controlled experiment: same generator, same product catalogue, same spec, three fixed hours, thirty days.
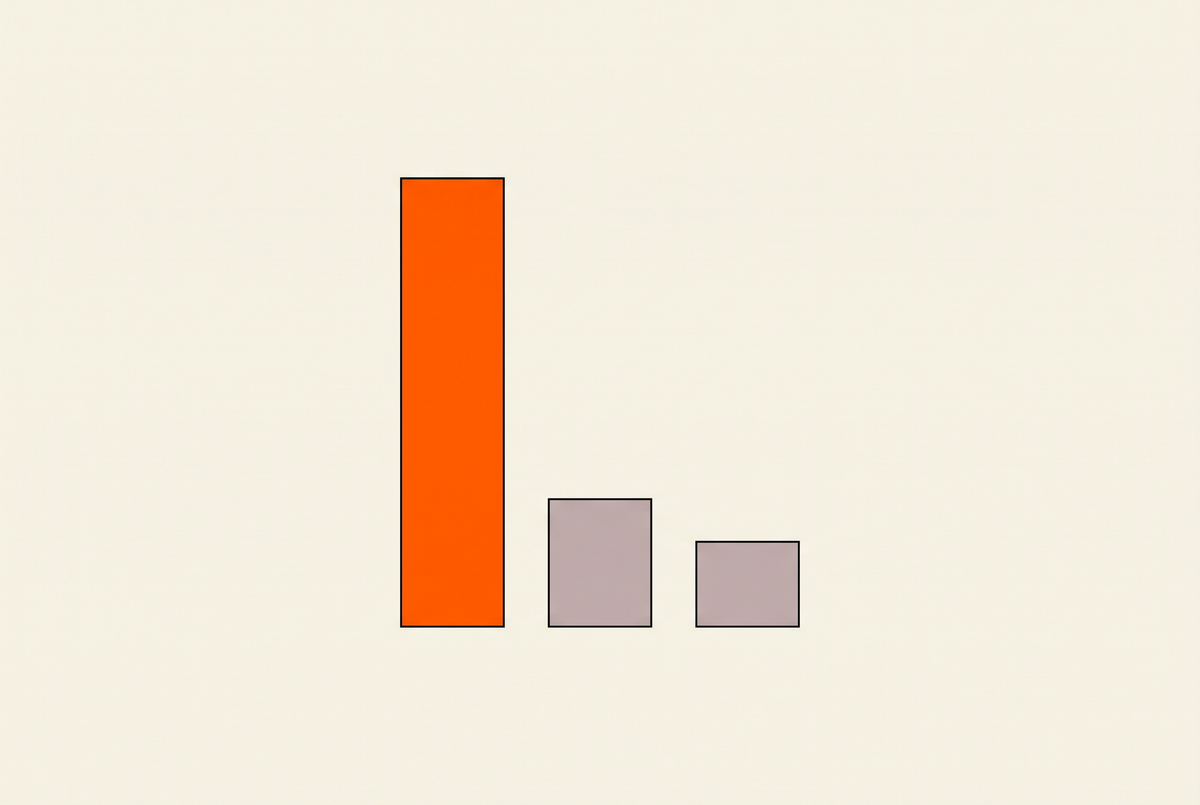
The result was not subtle. One of my three daily slots earns roughly twenty times the median views of the other two, and it has been doing so quietly for a month while I kept feeding all three equally.
The setup
Ninety clips over 30 days on one YouTube channel, 37,306 total views. Every clip is 9:16, 720p, 15 seconds, generated the same way, finished the same way, and published automatically at 10:00, 14:00 and 17:00 UTC. Nothing about the pipeline changes between slots — the scheduler simply takes the next finished clip and posts it at the next open time.
That last detail matters, because it means clips are assigned to slots in production order rather than by quality. Nobody is saving the good ones for the morning.
What 90 clips say
| Slot (UTC) | Clips | Median views | Mean | Best |
|---|---|---|---|---|
| 10:00 | 24 | 795 | 1,202 | 11,110 |
| 14:00 | 30 | 42 | 133 | 1,312 |
| 17:00 | 26 | 28 | 100 | 827 |
The 10:00 slot's median is 19x the 14:00 slot and 29x the 17:00 slot. Its mean is nine times higher. Its best clip did 11,110 views; the best clip either afternoon slot ever produced did 1,312.
Twenty-four clips took more than two-thirds of the month's views. Fifty-six clips split the rest.
The confound I had to rule out first
I have been caught by this exact trap before. The last time I measured something on this channel, what looked like a finding about naming products turned out to be a finding about something else that travelled with it. So before believing the slot, I checked whether the slot was really carrying a product effect.
It is a fair worry here. The catalogue is seasonal, production is batched by garment type, and knitwear and dresses do not perform alike. If dresses happened to land at 10:00 and jumpers at 17:00, the table above would be about garments, not hours.
So I restricted the comparison to one category — dresses only, every slot:
| Slot (UTC) | Dress clips | Median views |
|---|---|---|
| 10:00 | 12 | 891 |
| 14:00 | 13 | 41 |
| 17:00 | 8 | 26 |
Same product category, same generator, same month. The gap widens rather than closing: 22x against 14:00 and 34x against 17:00. Whatever is happening is happening to the hour, not to the garment.

Why 10:00 and not the hour a guide told you
Here is the part the heat maps get wrong. 10:00 UTC is midday in Stockholm, and this channel sells to a Swedish audience. The winning slot is not a universal hour — it is lunchtime where the viewers are.
I can show that it is account-specific because I run a second channel, in English, for a different audience. Nineteen clips, 10,159 views, two main slots:
| Slot (UTC) | Clips | Median views | Best |
|---|---|---|---|
| 15:00 | 4 | 870 | 1,645 |
| 20:00 | 5 | 111 | 1,066 |
Different channel, different audience, different winning hour — and an 8x gap of its own. If I had copied the first channel's 10:00 slot onto the second, I would have missed. The numbers here are small enough that I would not bet the schedule on them yet, but they are enough to say the answer does not transfer.
That is the whole point. The hour is not a property of the platform. It is a property of your audience, and the only instrument that can read it is your own back catalogue.
What I changed
The obvious move — put everything in the winning slot — is the wrong one, and worth saying plainly because it is tempting. Stacking three clips into one hour on the same account suppresses the other two; the platforms treat it as flooding, and I have measured that separately. Three clips a day still means three separate hours.
What the data actually supports is narrower:
- Move the weak slots, do not delete them. 14:00 and 17:00 are not bad hours in the abstract; they are bad hours for this audience. They get shifted toward the winning window, not merged into it.
- Put the best clip in the best slot. Production order is a terrible allocation rule when one slot is worth 20x. The strongest clip of the day now goes to 10:00 deliberately.
- Re-measure monthly. A slot that wins in August is not guaranteed to win in November — audience routines move with the season and the daylight.

How to run this on your own account
You need three things, and only three: fixed slots, enough clips, and the discipline not to change anything else while you measure.
- Fix your posting times and leave them alone for at least four weeks. A schedule that drifts cannot be measured.
- Get to 20+ clips per slot. Below that, one viral clip moves the mean and you will draw the wrong conclusion. Read the median, not the mean — mine differ by a factor of eight in the winning slot alone, because one clip did 11,110 views.
- Control for one obvious confound before believing the result. Restrict to a single content type and re-run. If the gap survives, it is real.
- Change one thing — the slot — and let it run another month.
The measurement costs nothing. The clips were going out anyway; the only new work is reading your own analytics honestly, including the part where the thing you have been doing for a month turns out to have been worth a twentieth of what it could have been.
The uncomfortable version of this finding
Two-thirds of my output for a month landed in slots that were worth almost nothing. That is not a generation problem — the clips in the 17:00 slot are the same quality as the ones at 10:00, made by the same pipeline on the same day. They were simply published into an empty room.
It is worth sitting with that, because the instinct when views are low is always to blame the creative. Better hooks, better renders, more cuts. I spent weeks on exactly that. The single largest lever on this channel turned out to be a number in a scheduler, and it was measurable from data I already had.
If you are posting AI video daily and your views are flat, check the hour before you rewrite the script.
The hour that wins is not the same hour on every platform, which is why the finding above is a method rather than a number to copy. A slot is worth what the audience awake in it is worth, so the moment the same clip goes to a second platform the whole test has to be re-run there — TikTok front-loads distribution in the first hour after publishing far harder than YouTube does, and a shop feed adds a buying window on top of the watching one. The measurement is the transferable part: hold the creative still, move only the timestamp, and give each slot the same number of clips before reading it. How that plays out when the clips are selling a catalogue rather than building a channel is in AI video generator for TikTok Shop.
The effect is largest on the platforms with the narrowest active window, and LinkedIn is the extreme case: its audience is awake for business hours in one timezone rather than all day in every one, so the penalty for publishing into the wrong slot is harsher there than on a consumer feed. The same three-a-day cadence that spreads clips across a YouTube day will put two of them where nobody is on LinkedIn. Worth testing the hour before concluding the format does not work — what does travel to that audience is covered in AI video generator for LinkedIn.
I publish what I measure on this channel and the rest of the pipeline — the prompts, the failures, the numbers that did not work out — inside the community. If you want the working versions rather than the write-ups, join us here.
Looking for something else? Browse all 124 AI video guides in one list.
Share:
AI Video Generator for Etsy Sellers: What Actually Works
AI Video Generator for Gyms: What Works and What Backfires